

Share This Article:

Medicare Releases Fiscal Year 2023 Data on Workers’ Compensation Medicare Set Asides
10 Dec, 2023 Shawn Deane
Shawn Deane
General Counsel & Vice President of Claims Solutions | J29 Solutions
On December 4, 2023, the Centers for Medicare & Medicaid Services (CMS) released “Workers’ Compensation Medicare Set-Aside (WCMSA) Fiscal Year Statistics 2023.” The report provides certain WCMSA data for Fiscal Years 2020-2023 and can be found here. The format is identical to the report released last year for Fiscal Year (FY) 2022.
Breaking Down the Charts
The one-page report is broken down into two tables. The first table covers WCMSA proposed values, which are related to figures submitted to the Workers’ Compensation Review Contractor (WCRC) for review. By way of brief background, the WCRC is the CMS contractor that reviews and renders decisions on submitted WCMSA proposals.
Table 1 includes FY statistics broken down by:
- Total WCRC Recommendations Completed (where a decision was rendered by the WCRC)
- Total Settlement Amount (aggregated settlement amounts associated with WCMSAs)
- Total Settlement Amount Average (the average of each settlement amount associated with a WCMSA)
- Total proposed WCMSA Amount (aggregated proposed WCMSA amounts – not the “recommended” or “approved” amount by CMS)
- Total Proposed WCMSA Average (the average amount of each proposed WCMSA – again, not the final “approved” amount by CMS)
The second table indicates figures related to WCRC values, which are associated with the WCRC’s determination following WCMSA submission and the WCRC’s review. In other words, this table contains amounts/figures related to what CMS indicates the WMCSA should be (i.e., the approved amount) vs. what the submitter initially proposed.
Table 2 includes FY statistics broken down by:
- Total WCRC Recommended WCMSA Amount (aggregated contractor determined WCMSA approved amounts)
- Total WCRC Recommended WCMSA Average (the average amount of each WCRC approved WCMSA)
- Percentage Proposed vs. Recommended Change (the % difference between the submitter’s proposed amount vs. the WCRC’s determined amount – i.e., “counter higher”)
- Recommended Medical Amount (WCRC determined aggregated amount associated with the healthcare portion of WCMSAs)
- Recommend Medical Amount Average (the average WCRC determined amount for the healthcare portion of an individual WCMSA)
- Recommended Rx Amount (aggregate amounts associated with the prescription drug potion of WCMSAs as determined by the WCRC)
- Recommended Rx Amount Average (the average WCRC determined amount for the prescription drug portion of an individual WCMSA)
Highlights & Analysis
CMS Decisions Increased in FY 2023
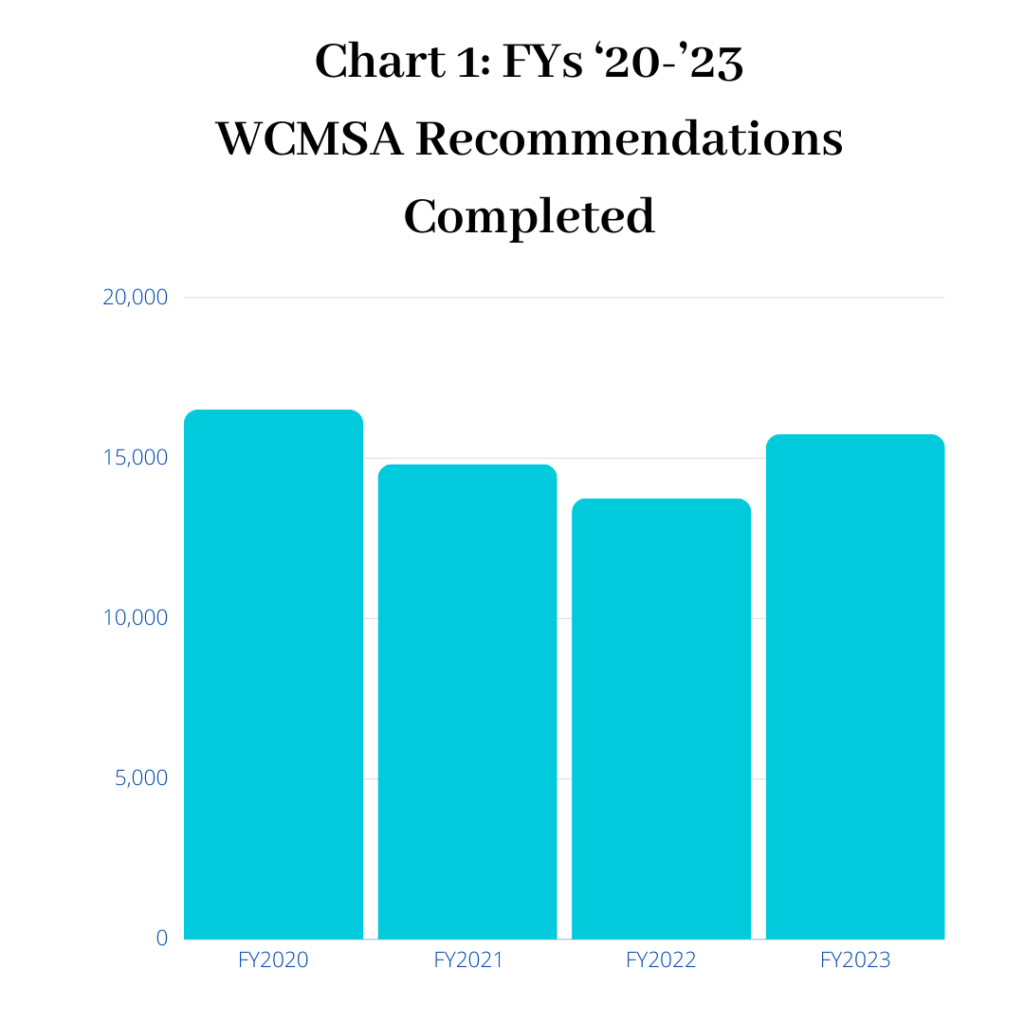
FY 2023 saw a total of 15,743 decisions, which was a 14.47% increase over FY 2022’s figure of 13,752. As Chart 1 below depicts, there was a decrease from 2020-2022 in WCMSA recommendations. Overall, it is unclear how closely WCMSA total submissions track with recommendations/approvals as this data is not present in the report. It may be helpful for the stakeholder community to understand how many WCMSA submissions occurred where a recommendation/approval was not rendered. In other words, how many total submissions were there? Moreover, this data set does not appear to include zero ($0) submission approvals or whether the approval stemmed from first-time submissions or an Amended Review. In addition to this, it would be instructive if CMS released data and statistics in relation to development requests (i.e., instances where the WCRC requires additional information to render a recommendation).
Overall, there are a multitude of contributing factors which might play into the increase in decisions. They may include stakeholder adoption of WCMSA submission in relation to CMS’s non-submit policy (as outlined in Sec. 4.3 of the WCMSA Reference Guide), or internal operational changes with the contractor that contributed to the increase.
MSA Amounts
Proposed (initially submitted) WCMSA amounts have remained relatively consistent over FYs 2020-2023, with an average over those four years being $71,915.13. The average proposed amount in FY2023 was $70,887.33, a de minimis decrease (-0.83%) from FY2022’s corresponding figure, which was $71,486.37.
Recommended or approved WCMSA amounts averaged approximately $83,000.00 over a four-year period, with FY2023 having an average approved amount of $86,452.67, a 5.9% increase over FY2022’s corresponding figure of $81,571.75.
Total recommended approved amounts in FY2023 were over $1.36 Billion, up from $1.12 Billion in the previous year, due in part to the increase in recommendations completed and the percentage increase in recommended change (proposed vs. approved). The total combined approved amount from FY2020-2023 is over $5.07 Billion.
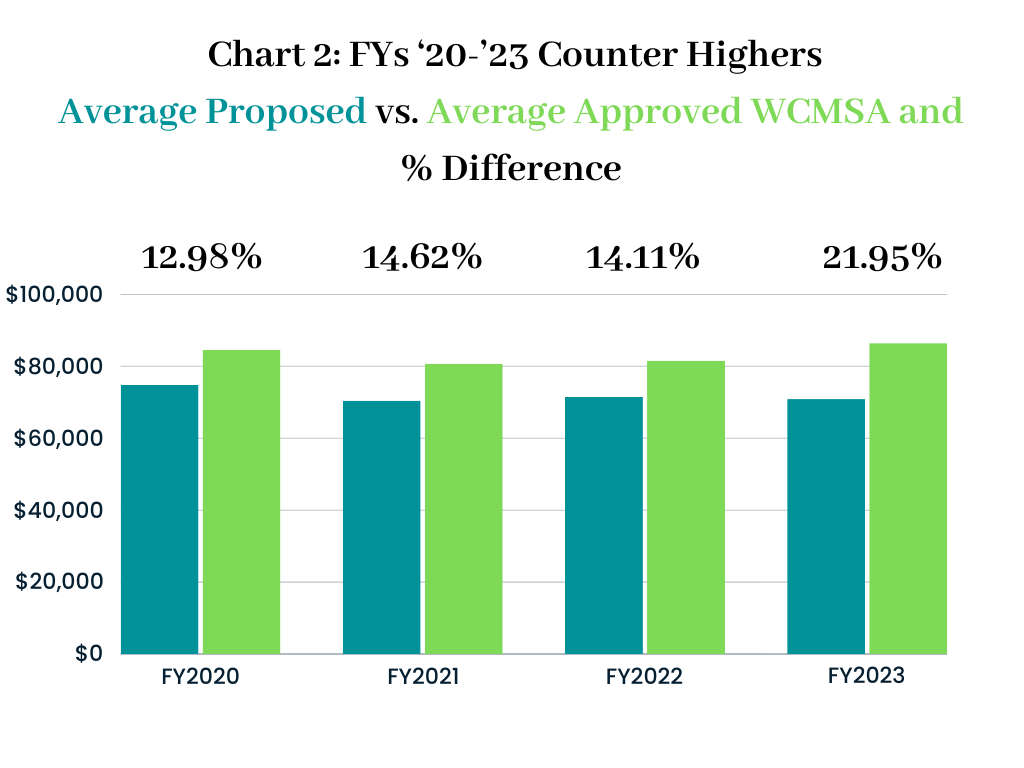
“Higher” Counter-Highers
When the WCRC renders a decision on a WCMSA submission with a recommendation/approval for an amount higher than initially proposed, this is often referred to as a “counter higher.” See Sec. 9.4.4 in the WCMSA Reference Guide, v.3.9., at pg. 21. The difference between the initially proposed WCMSA amount vs. the CMS approved amount has increased from FY2022 to FY2023 (from 14.11% to 21.95%). Reasons for this may be linked to an overall increase in submissions as well as changes in the methodology by the contractor – or allocation techniques and tactics by submitters. See Chart 2 below for the differences over time.
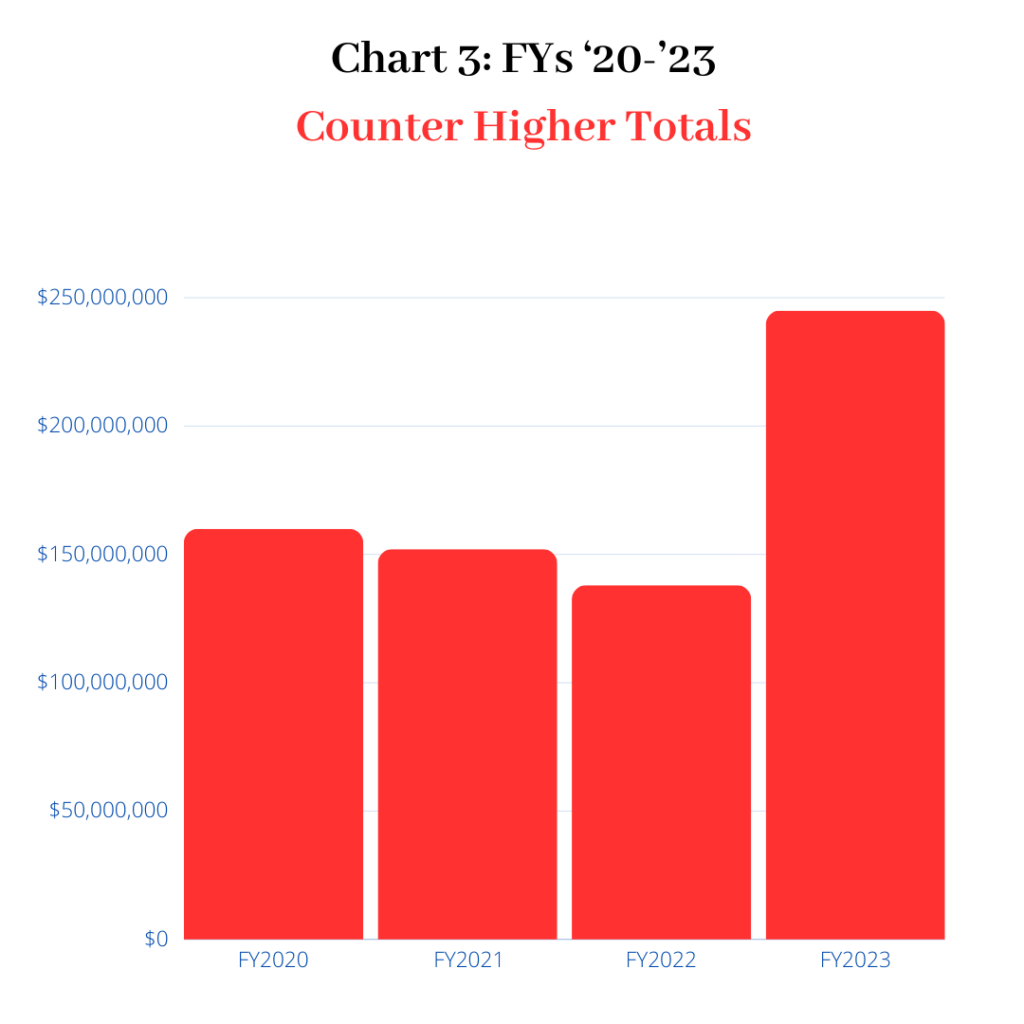
FY2023 saw an average proposed WCMSA amount of $70,887.33 with an average approved amount of $86,452.67. In FY2023, total the difference in proposed vs. approved (counter higher) amounts totaled $245 million (compared to $138 million in FY2022). Chart 3 below depicts aggregated counter higher totals (i.e., difference between the approved vs. proposed amounts) over the FY2020-2023 period.
WCMSA Average Amounts for Medical Up & Rx Down
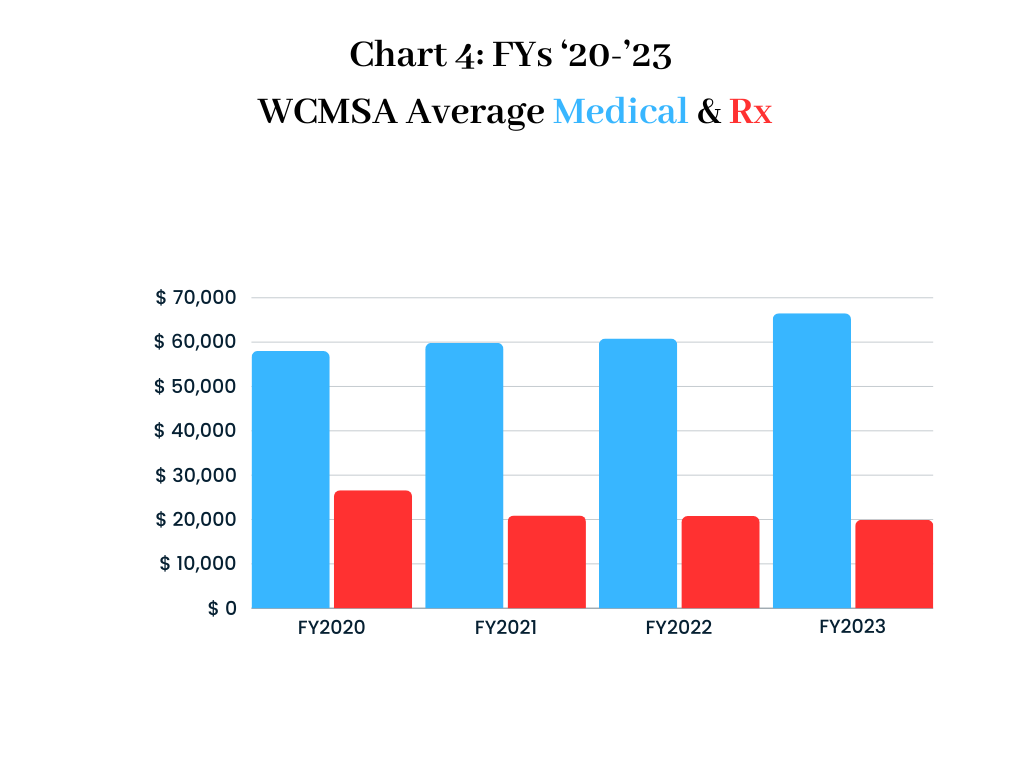
While a breakdown of the proposed medical and Rx amounts is not provided in the CMS report, approved average medical amounts are trending upwards. There’s been an increase in 14% since FY2020 – FY2023 ($57,989.02 - $66,527,86) in relation to the approved average medical amount. On the prescription drug side, from FY2020-2023 there’s been a decrease of 25% (from $26,574.31 - $19,924.81). See below for Chart 4 depicting a breakdown of average WMCSA medical and Rx amounts.
MSA Figures in Proportion to Settlement Amounts
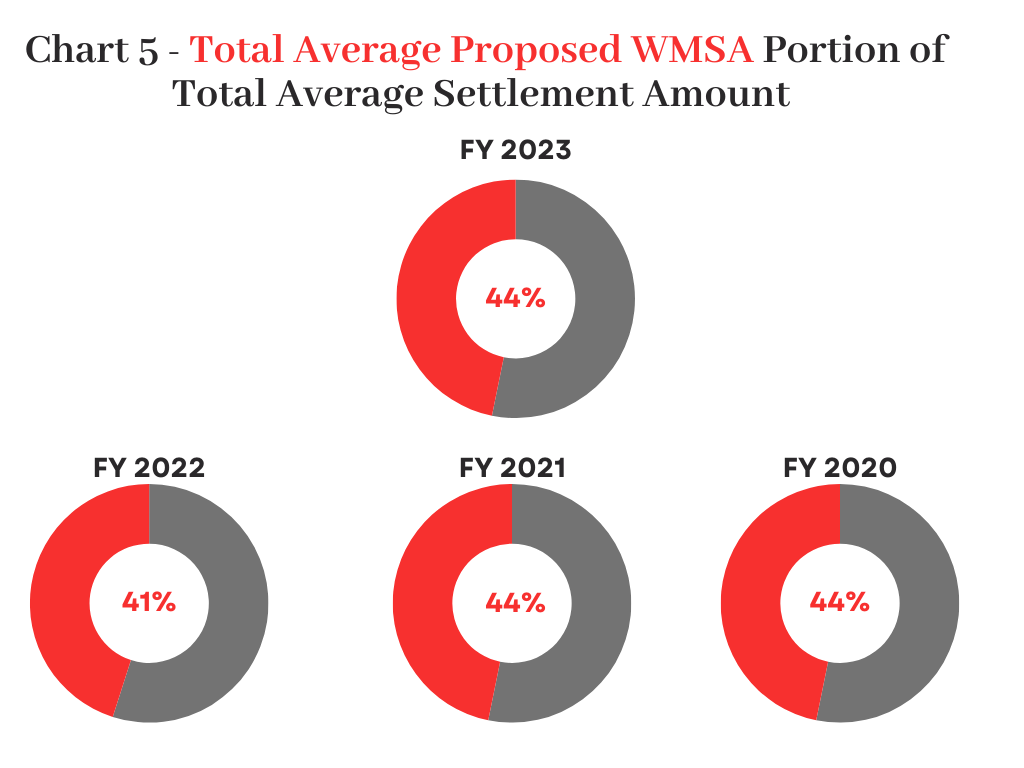
The average proposed settlement amount over FYs2020-2023 are approximately $165,000 with an average proposed settlement amount in FY2023 of $159,976.93, a 6.5% decrease from FY2022’s figure of $171,169.53. The portion of the WCMSA in relation to the proposed settlement amount has remained consistent from FYs 2020-2023 as Chart 5 below indicates (around 44%). What is not known is whether the final approved WCMSA amount coincides with the proposed settlement amount. Given the WCMSA and settlement process it may be difficult to tie back finalized settlement figures. It is assumed the proposed settlement amount in CMS’ provided data may differ from the actual final settlement figure.
Wrap Up
The industry commends CMS for providing data and information surrounding the Medicare Secondary Payer (MSP) program – specifically around WCMSAs. This information allows stakeholders and compliance professionals to make better, well informed, decisions and proactively plan for and anticipate changes and develop best practices. It will be interesting to track this data year-over-year with the backdrop of MSP regulatory and policy changes, including the anticipated requirement for Sec. 111 TPOC reporting of WCMSA information to determine if these changes affect trends in WCMSA submissions and decisions.
# # #
Author Bio
Shawn Deane
General Counsel & Vice President of Claims Solutions | J29 Solutions
(617) 435-9711
As General Counsel & Vice President of Claims Solutions, Shawn Deane leads J29’s Medicare Secondary Payer (MSP) services team. Shawn is a practicing attorney and has over 16 years of experience in Medicare compliance, workers’ compensation, and insurance claims. He was previously General Counsel & Senior Vice President of Risk Management & Compliance at the nation’s largest professional administrator of Medicare Set Asides. Prior to that he was Vice President of Medicare Compliance & Policy at one of the country’s largest Medicare Set Aside vendors. He’s an industry expert and thought leader in Medicare Set Asides (MSAs) and Medicare compliance.
About J29 Solutions
J29 Solutions is a women-owned small business that has focused on medical records review, claims analysis and program integrity, serving federal and state agencies. Given its expertise and capabilities, J29 entered the workers’ compensation / insurance space offering Medicare Secondary Payer (MSP) compliance services by providing Medicare Set Asides (MSAs), conditional payment / lien services and related solutions to all stakeholders – including carriers, self-insureds, third-party administrators, and attorneys. J29’s team is comprised of some of the most trusted legal and clinical experts in the industry.


AI california case file caselaw case management case management focus claims compensability compliance compliance corner courts covid do you know the rule employers exclusive remedy florida fraud glossary check Healthcare hr homeroom insurance insurers iowa kentucky leadership NCCI new jersey new york ohio pennsylvania Safety safety at work state info tech technology texas violence WDYT what do you think women's history women's history month workers' comp 101 workers' recovery Workplace Safety Workplace Violence
Read Also
About The Author
About The Author
- Shawn Deane
More by This Author
Read More
- Jul 11, 2026
- Chase Villeret
- Jul 07, 2026
- Lexi West
- Jul 06, 2026
- Christina Klemm
- Jun 29, 2026
- NCCI
- Jun 23, 2026
- Dennis Sponer
- Jun 02, 2026
- Nicole Usher